This essay was written in 1982 under the direction of Emory Thomas at the University of Georgia and was originally titled, “The Affluent Section: The South on the Eve of the War Between the States.”
“Once upon a time we all knew that the antebellum South was poor”, asserted Harold D. Woodman in the 1975 issue of Agricultural History. He was replying to Stanley Engerman’s argument that the antebellum South’s economy was prosperous and compared quite favorably with the economy of the Northern United States.
In the academic community and among much of the general populace the tacit assumption had been for many decades that the antebellum South was, at least taken as a whole, a poor land which compared unfavorably in almost every index of material prosperity with that of the North. After all the South lost the Civil War, and everyone knows the great predominance of the Union in population, railroad mileage, commerce, finance, and industry. The North’s economy was-much closer to the industrial, modern system that is equated with wealth and progress than was the South’s backward looking agrarian economy and paternalistic social system. Not only are there statistics to buttress these beliefs, but also eyewitness accounts of many travelers in the antebellum South. Men such as Frederick Law Olmsted described graphically the unfavorable, even wretched living conditions of many of the Southerners they met, Olmsted even asserting that nine-tenths of the neighbors of gentlemen he met “for a hundred miles around them lived in a manner which, if witnessed at the North, would have made them objects of compassion to the majority of our day-laborers.”[1]
Perhaps the most extremely denigrating view of Southern society was that painted by the British economist J.E. Carines during the Civil War in his book The Slave Power. Carines said that a small oligarchy of wealthy planters used four million slaves to rule four million wretched and debased whites, or, as they were known in the South, “white trash.”[2] While all historians conceded that there was a wealthy upper class in the South it had become commonplace—and still is to a very large extent—to view this class as quite exceptional with the great majority living a life more akin to the crude pioneer than to the wealthy aristocrat.
The very face of extreme poverty in the South after the Civil War among large numbers of both its black and white citizens has done much to bolster the belief that the antebellum South was poor, as has the relative raking of the Southern states at the bottom of almost every economic index since that great conflict.
Studies of the past few decades, however, have seriously questioned the old assumption of a markedly inferior Southern economy in the pre-war years. Frank L. Owsley was the first to establish that a large middle class existed in the antebellum South. Writers such as Phillips and Gray portrayed the slave regime of the Old South in a more sympathetic light but still saw the Southern economy as distinctively less vibrant than the Northern. Studies of regional income were among the first academic efforts to suggest Southern prosperity in the pre-war years. Richard Easterlin developed estimates of regional income for 1840, 1860, and subsequent years down to 1950. His estimates are based on commodity production and distribution for the earlier years. Those of 1840 are basically the work of Ezra C. Seaman, a Midwestern lawyer and government official, who used the 1840 census data to estimate regional income in a book first published in 1848 and revised in 1852.[3]
Even counting slaves and estimating their income at subsistence, Easterlin’s estimates place Southern per capita income at 76 percent of the United States average in 1840 and 72 percent in 1860. Per capita income in the South was higher than in the North Central states — the Midwest of today — a good comparison since both of these sections were overwhelmingly agricultural in their economic life. Southern white per capita income exceeded the national average and compared favorably with that of the Northeast. The West South Central region exceeded the Northeast in per capita income in 1840, even considering the slaves as part of the population. For the free population alone the North Central states had distinctly the lowest income per-capita.[4]
Revising Easterlin’s data, Stanley Engerman found a higher rate of growth of Southern per capita income over Northern between 1840 and 1860, 1.6 percent versus 1.3 percent if slaves are counted in the population. 1.8 percent versus 1.3 percent if only the free population is considered.[5]
These figures themselves, if true, would seem to topple the old notion of a stagnant, impoverished antebellum Southern economy. When one takes into account the greater urbanization of the North, in particular the Northeast, and the resultant higher cost of living there, the position of the South is even more markedly improved. Though apparently no studies have taken this factor into account it has important consequences for the standard of living.
But the major revisions in the traditional view of the antebellum Southern economy have come from the application of mathematical and statistical methods to historical data by a group of “new economic historians” or “cliometricians.” Their findings have been most dramatically stated and interpreted–in true iconoclastic fashion–by Robert Fogel and Stanley Engerman in their controversial book, Time on the Cross. Among their major conclusions are that “slavery as an economic system was never stronger” than on the eve of the Civil War; that “Southern slave agriculture [was] 35 percent more efficient than the northern system of family farming”; and that “the economy of the antebellum South grew quite rapidly. Between 1840 and 1860, per capita income increased more rapidly in the South than in the rest of the nation.”[6]
The only area in which Fogel and Engerman concede that South fell seriously behind the rest of the country in physical capital formation was in the manufacturing sector, and even here the authors consider the South to have compared favorably with the leading Western European nations in all indices other than the production of pig iron. They view the South’s comparative advantage to have been in agriculture rather than manufacturing.[7]
Virtually all of the data assembled by the cliometricians, and their interpretations of these statistics, portray the antebellum Southern economy on quite favorable terms with the Northern economy. For example, Heywood Fleisig found the average value of implements per farm, of buildings per farm, and of land and buildings per farm to have been greater in the slave than the free states, and the value of farming implements per improved acre to have been relatively close–$1.60 for the free states and $1.40 for the slave.[8] Fogel and Engerman even assert that “expenditures on farming implements and machinery per improved acre were 25 percent higher in the seven leading cotton states than they were for the nation as a whole.[9]
Contrary to earlier descriptions by historians of large scale reliance by cotton planters on the agricultural products of the Midwest, evidence has been amassed that the farms in the “cotton counties” were self-sufficient in food production. Drawing from a study of the manuscript census schedules of 1860, the Parker-Gallman sample of 5,229 farms in counties across the South producing 1,000 or more bales of cotton in 1859 revealed a per capita grain output on these farms of 53 bushels, significantly above the national per capita average of 38 bushels.
Similarly, the sampled farms were self-sufficient in meat production. Parker’s estimate, which he considers to be if anything biased against self-sufficiency, is that the sample farms produced enough meat to feed their slaves and over 400,000 free men. Gallman concludes that “the farms of the cotton South, far from being dependent on external sources of basic foods, were in a position to supply food to outsiders on an impressive scale.”[10]
Gallman’s procedures were deliberately biased against self-sufficiency by estimating “upper-bound” requirements in food consumption, and led to deficits in grain and meat needs for the entire South in 1860; however application to “better estimates” to requirements would restore self-sufficiency to the South as a whole.[11] Diane Lindstrom, in her study of interregional trade flows of grain, unearthed date “which cast doubt upon the previously held position that the south relied upon western grain supplies.”[12]
The matter of Southern self-sufficiency remains open to some debate. There were of course seasons of drought and consequent crop failures, and in those years notable mention of grain importations from the Midwest is mentioned in Southern newspapers. Some authors make quie a lot out of contemporary accounts of “famine” and imported foodstuffs.[13] In an agricultural economy like the antebellum South’s crop failures occurred some years and caused a dislocation in food supplies. Droughts as severe as the 1860 one which William L. Barney exploits in his book The Secessionist Impulse were quite rare. On the other hand, the census year 1859 on which Robert Gallman based his study of self-sufficiency is generally considered a better than average crop year. On balance it seems that during a normal year Southern farms as a whole were self-sufficient in food production or close to it, and that the South had only a minor dependence on food imports. The emphasis in much Southern writing of the 1850s on dependence upon external food supplies is obviously the result of a movement to make the South totally self-reliant in all fields, an attitude that would emphasize any dependence that existed.
The study, however, that gives the hammer blow to the idea that the antebellum South was poor, or even had wealth inequality greatly exceeding that of the North, is Lee Soltow’s Men and Wealth in the United States, 1850 – 1870. Basing his study primarily on “spin samples” of the 1850, 1860, and 1870 censuses, but also buttressed by the published census data, Soltow gives some startling statistics which confirm the wealth of the antebellum South.
Soltow’s spin samples revealed the average free adult male in the South to hold virtually twice the wealth of his Northern counterpart.[14] The division between North and South is the dichotomy between free and slave states. Soltow found that “the economic elite of the country was dominated by southerners in the antebellum period.” His figures reveal that 59 percent of the nation’s men in the top one percent of wealth-holders in 1860 were from the South.[15] Because of the population disparity between the two sections, the proportion of Southern men in this favored one percent was three times as great as that for Northern men—two percent of Southern men versus six-tenths of one percent of Northern men.
This data might seem to suggest extreme Southern inequality in wealth distribution but in reality the information shows surprising little divergence of inequality levels between North and South. The proportion of men who held real property in the South was slightly higher than for the nation as a whole in 1850, though somewhat less than the ration of real property holders in the Northwest (Ohio and west). By 1860 the proportion of Southerners holding land had increased somewhat, to 44 percent of adult free males, still slightly above the Northern percentage and only slightly less than the proportion in the Northwest, 45 percent. The South led each of the two major Northern regions in the percent of its free adult males who recorded real or personal property in the 1860 census—66 percent of Southerners to 64 percent of persons from the Northwestern states and 57 percent of Northeasterners.[16]
Students of the inequality of wealth distribution in antebellum America seem fairly well agreed today on a few conclusions: Wealth in both sections was distributed more equally in the countryside than in towns and cities,” wealth was more concentrated in the rural South than in the rural North, but the overall inequality in wealth between North and South did not differ by too significant proportions, largely because of the great inequality which obtained in urban areas.[17]
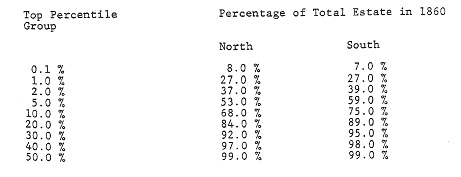
Soltow’s study reveals that 27 percent of the total wealth in 1860 in both the North and the South was held by the wealthiest one percent of free adult males. The top ten percent of the men of the South held 75 percent of total Southern wealth, while the same percent of Northern men held only 68 percent of wealth in their section. Similar greater levels of inequality among Southerners obtained for percentile brackets above one percent and below 40 percent, at which level the proportion of total wealth held became almost identical. These statistics reveal a surprising similarity of wealth distribution among the free men of North and South.
The following is Soltow’s chart showing the top percentile groups of free adult males and their percentage of total estate in 1860:[18]
Soltow based his study upon a sampling of free adult males found in the manuscript schedules of the censuses of population of 1850, 1860, and 1870. In order to ascertain the per capita wealth of all free persons and study in detail the regional pattern, the per capita wealth of each county of the 34 states of the 1860 nation was ascertained in the present study. The statistics back up Soltow’s findings.
The current study uses total free population as the primary base for comparison. Some authors give figures with slaves counted as potential wealth-holders, and even subtract from Southern wealth slave values. Such methods lower Southern wealth, the latter drastically. Though slaves held small amounts of personal property, it was not reported on the census schedules. Thus to include them as potential property holders slightly distorts the true wealth distribution. Most importantly, it presents an erroneous picture of Southern wealth, as only the free were in a position to accumulate the wealth reported. If the slaves had been free they would have been in a position to accumulate wealth, but that was not the situation of 1860.
To discount slave wealth gives an exceedingly false economic picture, as it constituted a prime element of Southern wealth and was easily convertible to cash or other forms of wealth if desired. Not to count slave wealth is an exercise in historical fiction.
Why few before Soltow used the published 1860 census data to assess Southern wealth is a mystery. The real and personal estate of each county, and of each state, is given. All one has to do is to divide those figures by the population of the given district and one has a detailed geographical measurement of the wealth of the nation per head. Soltow used this data as a backup for his study but somewhat misrepresented the values in so doing by dividing total wealth by the number of free men 20 and older, even though the wealth figures include that held by women and males under 20.
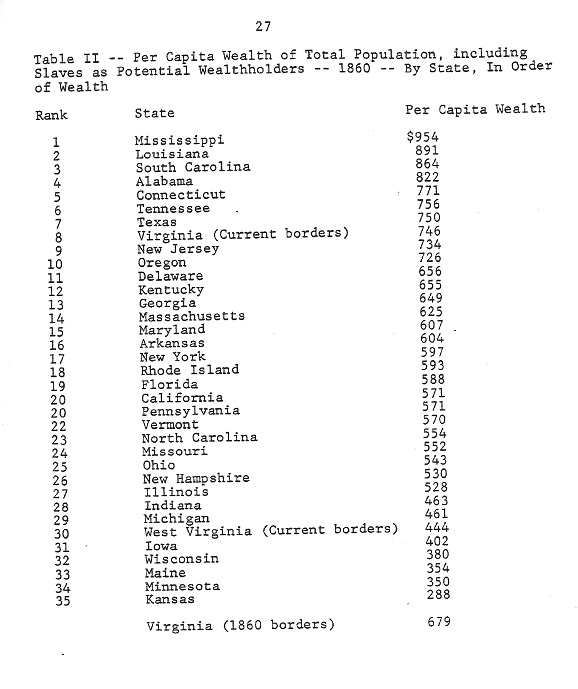
The results are astounding to a twentieth century American. The wealthiest state per capita then is the poorest in per capita income today—Mississippi. The poorest of the eleven Confederate States—Arkansas—was wealthier than the wealthiest Northern state—Connecticut. The wealthiest states were the most deeply Southern, many of which were among the most rural states of the Union.
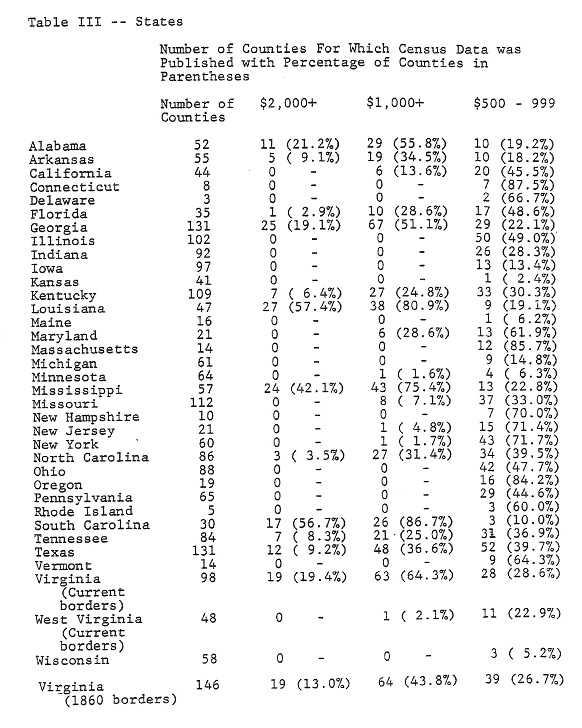
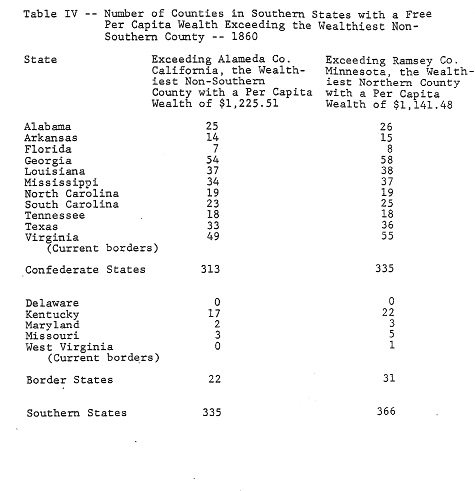
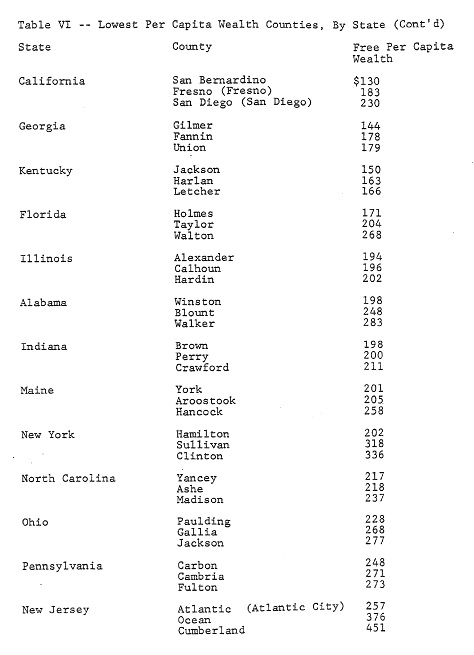
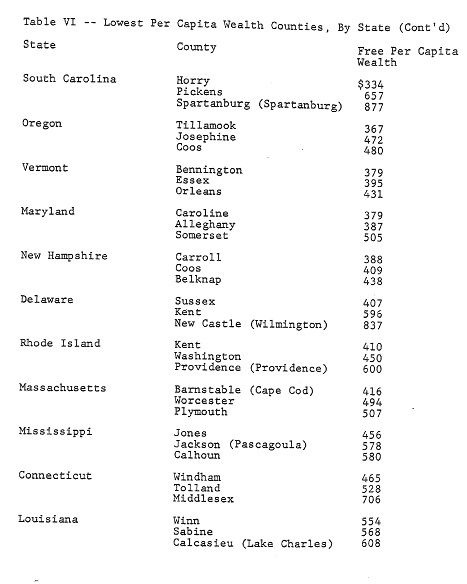
A county breakdown provides a dichotomy that sounds more like Southern propaganda gone wild than anything reasonable to modern ears. Three hundred and thirty-five (335) Southern counties were wealthier than the richest Northern county. Counties which today are among the poorest in the nation were then among the most affluent. The very poorest counties were Northern, and the number of Northern counties with a per capita wealth under $300 and under $200 exceeded the number of Southern counties in these categories, even though there were more counties in the South.
The extreme Southern poverty characteristic of the region depicted by Olmsted and Cairnes and a host of writers since then simply did not exist. Rather, though inequality of wealth was somewhat more prevalent in the South than in the North, the Southern states were far wealthier on a per capita basis—on an order of two to one. The wealth of the average Northerner in 1860 was $546.24; of the average free Southerner, $1,042.74.[19] The average free person in the future Confederate States, minus the counties which became West Virginia, was worth $1,255.45; in the seven states of the Lower South, $1,508.61.
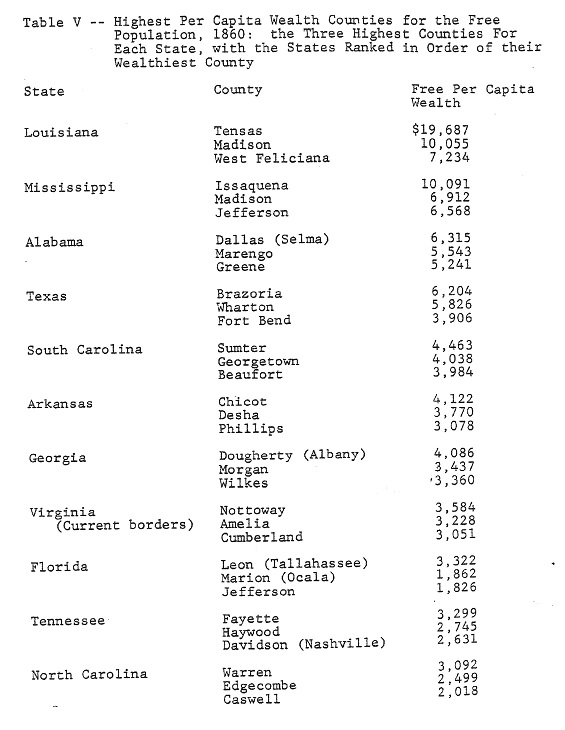
Average free per capita real estate wealth in the North was $377.22; in the South (without Louisiana), $426.93; in ten Confederate states, $446.42 (minus Louisiana and West Virginia). The per capita wealth of the Southern states, even if all the slaves are included as potential wealth-holders, was $706.20; of the eleven Confederate States (minus West Virginia), $752.75; and of the seven Lower South states, $806.59. These figures are substantially above the Northern per capita wealth of $546.24. And according to Soltow’s calculations, even without slave wealth and with slaves counted as potential wealth-holders, eleven Southern counties remained the nation’s richest, with Davidson County (Nashville), Tennessee in the lead.[20]
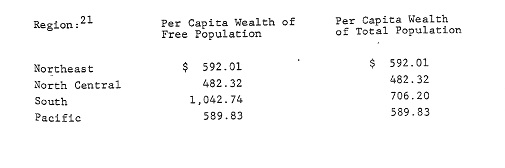
Regional comparisons are very interesting:[21]
The regions broken down into their respective divisions according to the current census bureau definitions, with the exception that Missouri is placed within the West South Central division, are:[22] 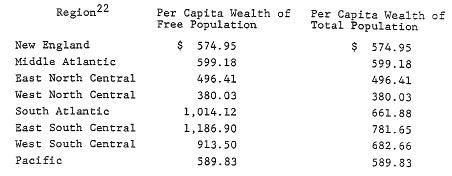
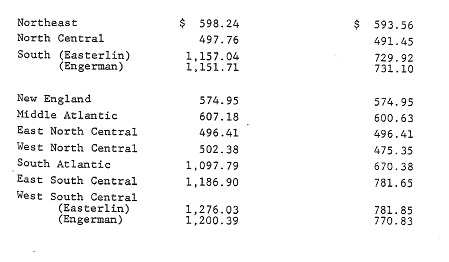
The following comparison uses the regions Richard Easterlin and Stanley Engerman employed for their per capita income estimates:[23]
A breakdown of the Southern states into the Lower South, the Upper South, and the Border states reveals these figures:[24]
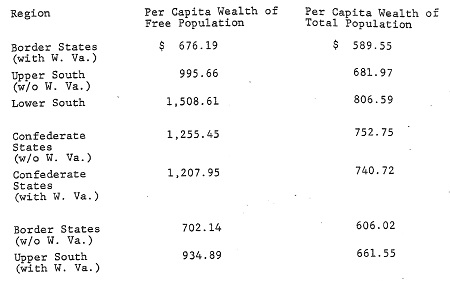
What is perhaps most interesting in this regional breakdown is the poor showing of the Northeast in comparison with regional income estimates of Richard Easterlin and Stanley Engerman. Both their estimates place Southern per capita income for the total population considerably lower than Northeastern per capita income, with the North Central states measured at only half the per capita income of the Northeast. The census wealth data shows the South to have a higher per capita wealth, even with the slave population counted, than the Northeast. The census wealth data shows the South to have a higher per capita wealth, even with the slave population counted, than the Northeast, with the per capita wealth of the North Central states comparing somewhat favorably with that of the Northeastern states—much more favorably than the ratio of per capita income between the two sections. The discrepancy may be due in large part to the higher cost of living in the more heavily urbanized and industrialized Sew England and Middle Atlantic states.
The Border states (including West Virginia), though with per capita wealth among both total and free population higher than Northern, had wealth levels closer to the North’s than to the four Upper Southern states of present-day Virginia, North Carolina, Tennessee, and Arkansas. The discrepancy between the per capita wealth of these Upper Southern states and the Lower South was even slightly greater than that between the Border states and the Upper South. Almost as striking a contrast existed between the eleven Confederate States and those of the Border as between the former and the North.
The three east-west divisions of the South held relatively similar per capita wealth. A large difference, however, separates the wealth of the Northeast from the Northern frontier states of Wisconsin, Minnesota, Iowa, and Kansas.
Maine should be added as an exceedingly poor state. Its per capita wealth of $354 was considerably below the $467 figure for West Virginia, the poorest state of the South; even counting all of West Virginia’s slaves her per capita wealth drops only to $444. New York, the empire state, could muster only $597 per inhabitant. The free citizens of all other Southern and border states enjoyed more wealth per person.
Per capita wealth in Southern States ranged from over $2,000 in Mississippi and South Carolina to under $600 in only one. The per capita wealth of only Connecticut and New Jersey in the North and Oregon on the Pacific rose above $700 and one state, Kansas, fell below $300. Twelve Southern states had per capita wealth above $800 while there were no Northern states so wealthy.
Even should all the slaves be counted as potential wealth-holders, Alabama, Mississippi, Louisiana, and South Carolina would remain as the nation’s wealthiest states. Virginia, Tennessee, and Texas would join them as more affluent than any Northern state except Connecticut. Georgia, Arkansas, Kentucky, Maryland, and Delaware would be wealthier than New York, and North Carolina, Florida, and Missouri would be richer than New Hampshire, Ohio, Indiana, Illinois, and Michigan.
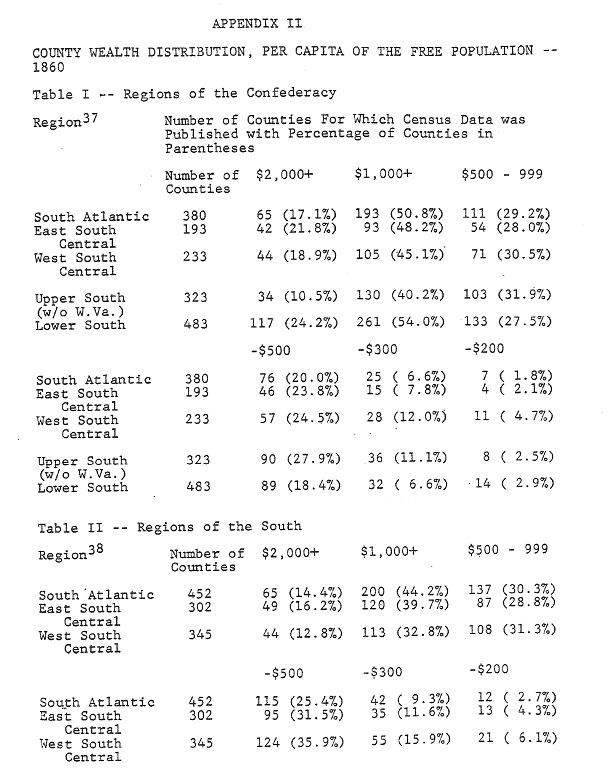
Surveying county wealth distribution a quite fascinating pattern emerges. The wealthiest counties in the nation—those with a free per capita wealth in excess of $1,000—were the plantation and high slave counties of the South together with most Southern urban counties in prosperous districts with the exception of the very largest—Baltimore, St. Louis, and New Orleans.
Only nine counties outside the South had wealth of $1,000 or greater, and six of these were in California. The three most affluent Northern counties east of California were Ramsey (St. Paul), Minnesota ($1,141.48 per capita); Bergen, New Jersey
($1,124.15); and Westchester, New York ($1,001.81), the latter two suburban New York City. In twelve states of the South 158 counties exceeded $2,000, with a majority of Louisiana’s and South Carolina’s counties in this elite group.
Furthermore, the nation’s wealthy counties were concentrated in the states which became the Confederacy. Of the 433 Southern counties with a free per capita wealth in excess of $1,000, 391 were in these states, forming 48.5 percent of the counties of the future Confederate States, without West Virginia. Percentages ranged from 86.7 percent of South Carolina’s counties to a quarter of Tennessee’s. A majority of the counties of Alabama, Georgia, Louisiana, Mississippi, South Carolina, and present-day Virginia were in this $1,000 and up class. The highest percentage of counties in this category found among the states adhering to the Union was Maryland’s 28.6 percent; the highest for a non-slave state—California’s 13.6 percent; and the highest for a Northern state—New Jersey’s 4.8 percent. Fifty-four percent of the counties of the Lower South were among this affluent class.
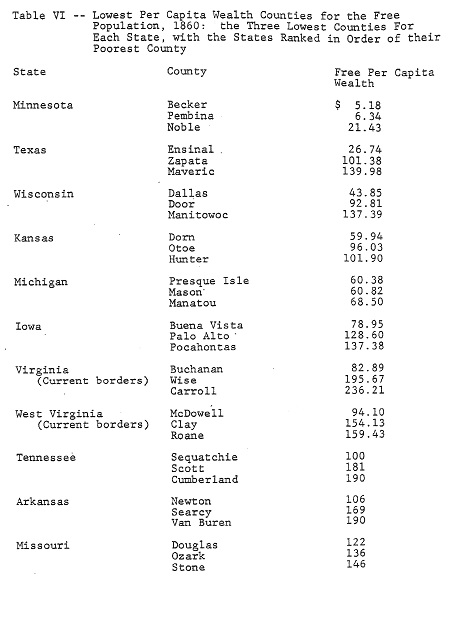
There were many Southern counties at the other end of the spectrum also, but surprisingly more Northern counties than Southern were in the poor and very poor categories of under $300 and $200 per capita. The poorest states in this respect were Michigan, Minnesota, and Kansas, on the frontier of settlement. Next came Wisconsin and the counties of Virginia which became West Virginia in 1863, followed by Maine, Missouri, Arkansas, and Iowa, all of these states having at least twenty percent of their counties below the $300 per capita level.
Over one-fifth of Northern counties had wealth of less than $300 per capita, compared to less than an eighth of Southern counties. And the Southern ones were concentrated in the Border states of West Virginia, Kentucky, and Missouri and the mountain counties of Arkansas. In fact the Border states had as high a percentage of these counties as the Northern states, with the percentage in the Confederate States being only 8.4 percent.
The Northeast had the lowest percentage of counties in this under $300 category, though this percentage was not greatly lower than the percentages of the South Atlantic and East South Central portions of the Confederacy. One New England state did have widespread poverty–almost a third of Maine’s counties had wealth of less than $300 per inhabitant, a higher proportion than any Southern state other than West Virginia. Though the remaining New England states did not possess a single county below this wealth level, neither did Mississippi, Louisiana, or South Carolina. All other states with the exception of Oregon, Delaware and Maryland had at least one county with a per capita wealth below $300. It is interesting that a higher percentage of Illinois’ counties were in this category than Alabama’s and that Pennsylvania and Georgia had virtually the same proportion of these poor counties.
A summary of the county per capita wealth distribution of the free population in 1860 by region is as follows:[25]
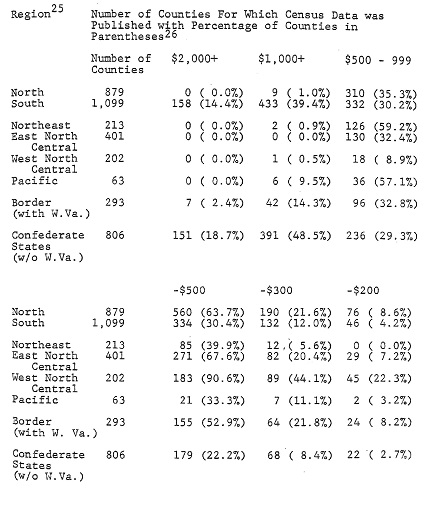
The extensive data which has been gathered by students of the Southern economy and which can be gleaned from the published census data demonstrate that the antebellum South’s economy was a vibrant, growing one at least as prosperous as that of the North, supporting a free population with a per capita wealth almost twice the North’s, and more so if the South be defined as the Confederate States. Strong evidence now indicates that inequality in wealth holdings between North and South did not differ greatly. Though county wealth inequality was twice as great in the South as in the North, this derives from the existence of a tremendous number of very wealthy Southern counties.[26] There were more poor Northern counties than Southern, with the major poor region of the country being the Northwestern and Midwestern frontier area of Kansas, Iowa, Minnesota, Wisconsin, and Michigan, where many counties had incredibly low wealth. The poorest Southern state—or what was to become a state—West Virginia, had per capita wealth greater than any of these states, as well as greater than two others, Maine and Indiana.
Why then is the idea current that the South on the eve of the Civil War was inhabited by a few wealthy men and great masses of dirt farmers with little in the way of material prosperity? Why is the North depicted as the possessor of great material wealth and prosperity and the master of a giant industrial economy waiting to be unleased, and the South as at best a quaint land of an outmoded order and at worst a region where the vast majority were oppressed into a cruel poverty?
These false images of the pre-war South had their origin in a number of sources—abolitionist and wartime propaganda and misconceptions; descriptions by Northern and foreign travelers, most of whom were biased against the South to start with because of a dislike of slavery; Southern self-criticism by such writers as DeBow calling for economic and cultural independence from the North; a propensity for Southerners to deride poor elements in society by such epithets as “white trash” and to popularize tales of the poorer, more ignorant people, especially in the days when the land was a frontier; and to the defeat of the South in a cataclysmic war and the resultant poverty which beset the region.
The descriptions by Olmsted and Cairnes are truly amazing in their assertions. The overall impression one has of the South from their works is of a land benighted to the utmost degree. With but few exceptions Olmsted portrays the planters as possessing nominal wealth in land and slaves but lacking in their homes even the comforts of an ordinary working man in the North. Other travelers portrayed a much different picture of Southern life.[27] But Olmsted’s flair for detail was so precise and his pen so graphic that his work from the outset became the classic “non-biased” description of the antebellum South to which historians have turned time and again.[28] A cursory review of the pages of his narratives helps explain why the impression of the antebellum South as a poor region has become so widespread. Part of Olmsted’s portrayal undoubtedly arose from the alien nature of Southern life to his New York and New England trained eyes but much of it can be attributed to his extreme hostility to the institution of slavery.[29] As a propagandist Olmsted was superb. J. C. Bonner correctly described Olmsted as “a condescending visitor [who} saw only what he came to see and…recorded his observations in terms of preconceived ideas, prejudice, and subjectivity.[30] Olmsted’s descriptions of Southern planters simply does not square with their great wealth and large income. He says that they invested almost exclusively in additional slaves. They did invest heavily in slaves but their income was amply sufficient to provide themselves with all the comforts of a typical Northern home and much more. If they did not have all the conveniences that Olmsted was accustomed to it was because of a different lifestyle or choice, not because they did not have the money to afford them. A. De Puy Van Buren, a young Michigan tutor to the families of Mississippi planters, provided an interesting insight into the reason why some common articles were not found in many planter’s houses: “A clock, almanac, and a good fire, are hard things to find in a planter’s house. The only chronometer he has, is the cotton-plant, and that ‘ticks’ but once a year. The word, haste, is not in a Southron’s vocabulary….”[31]
Despite the graphic portrayals by Olmsted and other travelers of wretched living conditions among much of the Southern population, it is clear from the census records and recent studies on inequality of wealth in mid-nineteenth century America that the North had at least as much poverty, and quite possibly more so, than did the South. But because slavery was viewed as the curse of the age, the guns of the reformers were trained on the South and were unmerciful in their descriptions of Southern living conditions. The result has been a grossly distorted view of antebellum wealth and the distribution of that wealth in the Northern and Southern sections of the United States.
Before the War for Southern Independence the advantage of the South in terms of individual wealth could not have escaped the attention of the North, certainly the great wealth held by the planters. Even Olmsted observed that “the wealth class is the commanding class in most districts of the South….”[32] Nor was this Southern dominance a recent phenomenon. Information unearthed by Alice Hanson Jones in her study of colonial wealth indicates that average wealth in the Southern colonies on the eve of the American Revolution was over twice that of the Middle and New England colonies, with a per capita income advantage of the same proportions. Her evidence also shows the colonial South to have had the greatest number of very wealthy men.[33]
Numerous books on Southern history speak of such terms as “the slaveholding dynasty,” the “proud Southern ‘barons,'” and others.[34] Cairnes titled his polemic The Slave Power. Northerners resented the perceived Southern political dominance of the country.[35] Southern wealth undoubtedly produced jealously and resentment on the part of many Northern people. Coupled with the political power of the South and the arguments of the Republican Party, there was ample incentive for Northerners to want to clip the wings of the slaveholders, to reduce their power and even their affluence.
Thus Southern wealth may help explain why the North was so willing to wage a major war against Dixie. The haughty Southern barons were due a lesson. In a nation where “all men are created equal” how could Southern men be so much wealthier? It wasn’t right or just, so a typical Northerner might think. Since Southerners had broken the compact of Union in Northern eyes, it was free season to pour forth hostilities against them and destroy their wealth, which was gained with the unfair advantage of slave labor in the first place.
On the other “hand, Southern wealth and prosperity helps explain-why the Southern states were so bold as to secede and so confident that they could successfully establish an Independent nation. The depth of that wealth, its extension throughout society on a close par with the North, helps explain why the masses of Southerners supported secession and the Confederacy. It is not coincidental that the poorest regions were the areas of least support. The poorest county in Alabama “seceded” from the state during the war and the poorest Mississippi county exhibited the most pronounced Union sympathy of any county of that state during the conflict.
It is unfortunate that modern Americans have so distorted a view of the wealth patterns of the country on the eve of the War Between the States. They take for granted that the region which has been the poorest since that watershed was always so. They can better understand the conflict if they can comprehend the affluence of the antebellum South, not just among the top wealth-holders but spread far and wide throughout Southern society.


[1] Frederick Law Olmstead, The Cotton Kingdom (New York: Mason Bros., 1861), 280.
[2] J. E. Cairnes, The Slave Poweri (London: Macmillan and Co., 1863), 82-83, 103. Cairnes quotes Lord Sterling in Letters form the Slave States as saying “for all practical purposes we may still regard Southern society as consisting of aristocratic planters and ‘white trash’”, 83.
[3] Richard A. Easterlin, “Interregional Differences in Per Capita Income, Population, and Total Income, 1840-1950,” in Studies in Income and Wealth, Vol. 24: Trends in the American Economy in the Nineteenth Century, by the Conference on Research in Income and Wealth (Princeton: Princeton University Press, 1960), 105-106.
Stanley L. Engerman, “A Reconsideration of Southern Economic Growth, 1770-1860,” Agricultural History 49 (April 1975): 351-352.
The Seaman book is titled Essays on the Progress of Nations (New York: Charles Scribner, 1852).
[4] Easterlin, “Regional Income Trends, 1840-1950,” in American Economic History, ed. Seymour E. Harris (New York: McGraw-Hill, 1961), 526-28.
Easterlin, “Interregional Differences in Per Capita Income,” 92, 97-98.
The regional divisions are as defined by the U.S. Census Bureau, except that Maryland and Delaware are included within the Middle Atlantic Division rather than the South Atlantic.
[5] Engerman, “The Effects of Slavery Upon the Southern Economy: A Review of the Recent Debate.” Explorations in Entrepreneurial History, Second Series 4 (Winter, 1967): 86-87. Engerman’s major revision was including Texas in the South.
[6] Robert William Fogel and Stanley L. Engerman, Time on the Cross (Boston: Little, Brown, and Company, 1974), 5-6.
[7] Ibid., 254-55
[8] Heywood Fleising, “Slavery, the Supply of Agricultural Labor, and the Industrialization of the South,” Journal of Economic History 36 (Sept. 1976): Appendix, Table A-1, 596-97.
[9] Fogel and Engerman, 255.
[10] Robert E. Gallman, “Self-Sufficiency in the Cotton Economy of the Antebellum South,” in The Struture of the Cotton Economy of the Antebellum South, ed. William N. Parker (Washington: The Agricultural History Society, 1970), 6-7, 18-19.
[11] Engerman, “The Antebellum South: What Probably Was and What Should Have Been,” in The Structure of the Cotton Economy, 127-137.
[12] Diance Lindstrom, “Southern Dependence Upon Interregional Grain Supplies: A Review of the Trade Flows, 1840-1860,” in The Structure of the Cotton Economy, 101.
[13] See William L. Barney, The Secessionist Impulse (Princeton: Princeton University Press, 1974), 153-63.
[14] Lee Soltow, Men and Wealth in the United States, 1850-1870 (New Haven: Yale University Press, 1975), 65.
[15] Ibid., 101.
[16] Ibid., 41, 184.
[17] Edward Pessen, “How Different from Each Other Were the Antebellum North and South?” The American Historical Review 85 (December 1980): 1131-1134; Gavin Wright, The Political Economy of the Cotton South (New York: W.W. Norton & Co., 1978), 25-26, 38-39; Soltow, 99, 103.
[18] Soltow, 99.
[19] These statistics and the counties sampled are of the states of the 1860 Union. The territories and the District of Columbia are excluded.
[20] Soltow, 170-171.
[21] Northeast=New England, New York, New Jersey, and Pennsylvania; North Central=Ohio, Indiana, Illinois, Michigan, Wisconsin, Minnesota, Iowa, and Kansas; South=the slave states; Pacific=California and Oregon.
[22] Middle Atlantic=New York, New Jersey, and Pennsylvania; East North Central=Ohio, Indiana, Illinois, Michigan, and Wisconsin; West North Central=Minnesota, Iowa, and Kansas; South Atlantic=Delaware, Maryland, Virginia, West Virginia, North Carolina, South Carolina, Georgia, and Florida; East South Central=Kentucky, Tennessee, Alabama, and Mississippi; West South Central=Missouri, Arkansas, Louisiana, and Texas; Pacific=California and Oregon.
[23] The Northeast and Middle Atlantic regions include Maryland and Delaware. The North Central and West North Central regions include Missouri. The South and its component divisions exclude Maryland, Delaware, and Missouri. Easterlin included only Arkansas and Louisiana in the West South Central region, but Engerman added Texas.
[24] Border States=Delaware, Maryland, Kentucky, and Missouri; Upper South=Virginia, North Carolina, Tennessee, and Arkansas; Lower South=South Carolina, Georgia, Florida, Alabama, Mississippi, Louisiana, and Texas; West Virginia is shifted back and forth between divisions because it was a part of Virginia in 1860 and at the time of the state’s secession. Wealth data of the 48 Virginia counties which became West Virginia in 1863 were assembled in order to treat that section of Virginia as a separate state for purposes of comparison.
[25] North=free states; South=slave states; The Northern divisions include only free states; Counties with incomplete totals were omitted form the calculations. Only 31 counties of the states of the 1860 nation are omitted from the table, apportioned among the states as follows: Florida, 2; Georgia, 1; Iowa, 2; Louisiana, 1; Michigan, 1; Mississippi, 3; Missouri, 1; and Texas, 20.
[26] Soltow, 158.
[27] Among many descriptions see J.S. Buckingham, Slave States of America, 2 vols. (London: Fisher, Son & Co., [no date]), especially Vol II, 126-128; Lester B. Shippee, Ed., Bishop Whipple’s Southern Diary, 1843-1844 (Minneapolis: The University of Minnesota Press, 1937), especially 30 and 84; and A. De Puy Van Buren, Jottings of a Year’s Sojourn in the South (Battle Creek, Michigan, 1859(.
[28] Olmstead, The Cotton Kingdom, Arthur M. Schlesinger, ed. (New York: Alfred A. Knopf, 1953), xlvi. Schlesinger thought it “difficult to conceive of a more objective critic of Southern life.” Ibid., xlvi.
[29] Olmstead was educated at Yale and owned a farm on Staten Island.
[30] James C. Bonner, “Profile of a Late Ante-Bellum Community,” The American Historical Review 49 (July, 1944), 663.
[31] Katherine M. Jones, The Plantation South (Indianapolis: The Bobbs Merrill Co., 1957), 372.
[32] Olmstead, The Cotton Kingdom, ed. Schlesinger, 558.
[33] Edwin J. Perkins, The Economy of Colonial America (New York: Columbia University Press, 1980), 150-154.
[34] See for example Avery O. Craven, The Growth of Southern Nationalism, 1848-1861 (Baton Rouge: Louisiana State University Press, 1953), 34-35, 186, 189.
[35] For a classic statement of Southern political ascendency in the Union see William Garrott Brown, The Lower South in American History (first published in 1902, reprint edition, New York: Haskell House Publishers, 1968); Cairnes in The Slave Power at page 97 described the power of the slaveholders as “a despotism…by the wealthy few…which for half a century has exercised paramount sway in the councils of the Union.”